Quick View
***************************************************************************
* 法律声明
* 版权所有:重庆比纯软件科技有限公司
*
*
* 比纯调试器及其文档是重庆比纯软件科技有限公司财产。没有
* 比纯软件科技正式许可,任何个人和单位不得将产品及其文档
* 用于商业活动。
*
*
* LAW DECLARATION
* Copyright (C) by Chongqing btrue software technology co.,ltd
*
*
* BTR debugger product and its document is the property of Chongqing
* btrue software technology co.,ltd. Any person or orgnization
* can't use it in commercial field without offical permission.
***************************************************************************
Welcome to use BTR debugger.
BTR debugger is a true source code level debugger.
In windows , BTR debugger 2.0 can debug MCUs[large ram] , Python , Go ,VC,JAVA, Kotlin , C#, Android , Qt , Node , Php , Driver ,matlab . In linux, BTR debugger 2.0 can debug GCC , JAVA , Kotlin , Android , Qt , Driver , embedlinux , Python , Go ,Php , Node , Uboot , Kernel. In BSD Unix , BTR debugger 2.0 can debug GCC . In android device, BTR debugger 2.0 can debug JAVA ,C , Qt , Kotlin . In MacOS | iOS, BTR debugger 2.0 can debug Object-C , Swift.
BTR debugger 100% report crashed code , 100% report thread unlimited loop code.
BTR debugger brings process log technology . It collect and filter process tracing data automatically. It is better than code break point technology.
Code logical bugs can be found quickly by using its code log. BTR debugger remember each actually running code line. Look at the code running history , your logical bugs can be find quickly and clearly!
BTR debugger track program resource open and close. Ram pointer, file, socket , object , ... can be tracked.
BTR debugger track program variable. When the value of variable changed , BTR debugger immediately remember the current value and the running code line.
BTR debugger support break point.
BTR debugger's time used statistics can improve your program performance.
BTR debugger has no configuration in default case.
Copyright(C) btrue software technology co., ltd
BTR debugger's main functions show as following:
1) flash
User can watch the latest 60000 code runing lines. Many bugs hide here.
2) log
Trace each code line , save it to code log. All bugs hide here.
3) pointer trace
Wild pointer or unfree pointer report in real-time.
4) message output
Debug message output to console.
5) variable trace
Trace the variable value changement , address , stack / heap map all variables.
6) time statistics
Used time statistics
7) break point , watch point
User can set code break point. In some cases, such as MCU , kernel , break point do not work well. However, watch point works well, it takes snapshot and do not break the process.
8) trace step by step
Trace the code line step by step.
9) func
The called functions sequence.
10)resource
trace resource open and close.
11)debug multiple projects in one time
debug program and its library projects in one time . debug the client and server process in one time. debug android java and jni c in one time.
If your project existed in /path1/path2/.../pathn, BTR debugger build the project is:
build /path1/path2/.../pathn
or,
./btrue.exe build /path1/path2/.../pathn ( WIN like: btrue.exe build e:\temp\MyProject )
The dir must be absolute path and may include blank chars in windows. BTR debugger will analysis the project code and build it. The result of build package will include debugged plugin.
If build sucessfully , message shows: Msg 50017: build ok. Otherwise indicate build failed.
Only use BTR debugger build your project first, then you can use BTR debugger debug them .
You can use BTR debugger build multi - projects in one time. Then debug these projects in one time.
You must build your project ok manually. Then use BTR debugger build them.
|
language |
build example |
note |
|
vc6 vc2003- vc2019 |
build d:\BTR debugger\demo\win\hellowindow build d:\BTR debugger\demo\win\tstdll build d:\BTR debugger\demo\win\usedll build c:\Programe Files\myproj\test |
|
|
java jdk J2EE |
build d:\BTR debugger\demo\win\javahello build d:\BTR debugger\demo\win\javabean build d:\BTR debugger\demo\linux\servlet |
support eclipse , jboss , bea , ... |
|
vc# vc#2008- vc#2019 |
build d:\BTR debugger\demo\win\cs |
|
|
g++ gcc
|
build /BTR debugger/demo/linux/echo build /BTR debugger/demo/linux/mylib build /BTR debugger/demo/linux/mydll build /BTR debugger/demo/linux/uselibdll
build /BTR debugger/demo/unix/mylib build /BTR debugger/demo/unix/mydll build /BTR debugger/demo/unix/myexe
|
Linux: gcc Unix: gcc Win: GUI Gcc |
|
Driver |
build /home/usr/BTR debugger/demo/linux/mymoddrv build E:\WDK8.1\samples\ioctl\sys
|
|
|
Linux kernel |
build /home/usr/mylinuxmodule |
|
|
uboot |
build /opt/myuboot |
|
|
MCU
|
build d:\freescale\uart1_interrupt |
user use uart as debugger port.note: mcu must have > 100M ram memory. |
|
Python
|
build d:\python\pytest |
(Win , linux , unix ) Python |
|
Go |
build d:\golang\mygo |
(Win , linux , unix ) Go |
|
php |
build d:\golang\myphp |
(Win , linux , unix ) php |
|
Nodejs |
build d:\nodejs\mynode |
(Win , linux , unix ) nodejs |
|
Qt |
build /home/usr/BTR debugger/demo/linux/myqt build E:\BTR debugger\demo\win\myqt
|
( win , linux , android )Qt |
|
Nodejs |
build d:\nodejs\mynode |
(Win , linux , unix ) nodejs |
|
android (java)
android (c,c++)
|
build /BTR debugger/demo/linux/android ( android STUDIO , SDK , NDK )
build e:\BTR debugger\demo\win\android ( android STUDIO , SDK , NDK )
|
|
|
Object-c |
build /BTR/objectc |
|
|
Swift |
build /BTR/swift |
|
|
Matlab |
build /home/opt/matlabproj |
|
|
Command |
Usage and descript |
Example |
|
F2 |
F2 pause the debugged process |
F2 |
|
F3 |
F3 debugged process continue to run |
F3 |
|
help |
help print command usage |
help |
|
shutdown |
shutdown exit btrue.exe when process paused |
shutdown |
|
restore |
restore restore all code after build it |
restore |
|
build |
build <homepath> build <homepath> [subpath] build <homepath> a.c b.c c*.py (1) build a project (2) If supply subpath, then only debug the code in subpath; If no code in subpath, then BTR debugger is surely a command line buildr. (3) if aggsin a.c b.c durning build, then only debug a.c b.c, the build program will runs fast.
|
build d:\myproj build /home/usr/myprj build /home/usr/myprj init/db build d:\myproj a.c |
|
flash |
flash [filter] [-s file] Output the latest running code. When process crashed , the last output line is crashed line. |
flash flash -s a.txt (-s : save file) flash a.c -s a.txt |
|
lon |
lon log switch on ,so clog command is valid |
lon |
|
clog |
clog [filter] -s file output the whole running code. |
clog -s -m 90000 c.txt (=m:max lines) clog a.cpp -s d.txt clog -e b.cpp -s d.txt (-e: except b.cpp) clog a.c:633 -s c.txt (633 function declare line) (a.c:633 assign a function body) |
|
loff |
loff log off ,clog command is invalid |
loff |
|
fadd |
fadd file | word add filter , to filter flash or clog command |
fadd a.cpp fadd -e f.cs : 653 ( not include function f.cs : 653 ) fadd a.java : 981 (981 function declare line) (a.java:981 func declare line) fadd 'person->name'
|
|
flist |
flist list all filter that added by fadd |
flist |
|
fdel |
fdel #no del filter |
fdel 1 |
|
func |
func [filter] [-s file] output the latest functions sequence |
func func -s b.txt func a.c -s b.txt |
|
flog
|
flog -s file output the all function sequence when log on |
lon ... flog -s b.txt |
|
rfunc |
rfunc [filter] -s file output all running functions, all crash line include in these running functions. |
rfunc -s a.txt rfunc TestUnit.cpp -s a.txt |
|
bins |
bins <file : no> insert break point if no crash code , you should add break point then process run fast. |
bins a.cpp : 2149 bins [02149][a.cpp] bins -v a.c : 34 process will break at a.c:34 if bwatch(...) find var changed here. |
|
bdel |
bdel <no#> delete a break point |
bdel 1 |
|
blist |
blist list all break points |
blist |
|
F7 |
F7 trace step by step |
F7 |
|
F8 |
F8 each step must in a function |
F8 |
|
F9 |
F9 next step isn't in current function |
F9 |
|
pv |
pv list all unreleased resources assigned in [PV_FUNCTION] . list all unfree pointers ( malloc, free),(new,delete) |
pv (sock , ram , file,struct,sql... is resource) (h=open() close(h) is res function pair). |
|
kadd |
kadd <file : no > add a key pointer, the process will interrupt if key pointer released. |
kadd a.c : 2601 ( trace the resource of line a.c:2601 ) |
|
kdel |
kdel <no#> delete a key pointer.
|
kdel 1 |
|
klist |
klist show all key pointers
|
klist |
|
vlog |
vlog -s file output value change log. watch(var_name,v_addr,v_len) C,android c,MCU c,Qt C watch(var_name,class,object,member, datatype, datalen) C#,JAVA
|
vlog -s a.txt (The all changement of variable v is saved ) bwatch("str",string,s,s,string, 8); //open bwatch("str",string,s,s,string, 0);//close
|
|
vmap |
vmap [ filter ] -s file map all or part current variables value to file , only support c language |
vmap -s v.txt vmap a.cpp -s v.txt vmap a* -s v.txt
|
|
amap |
amap [pid] addr size single variable address value map. support sizeof( struct ) function, support c language. the address comes from vmap. amap 123000986 sizeof(in_addr) + 16 amap 123001486 sizeof( person ) * 15 + 32 |
amap 13889944 32 amap 16012122 16 * 10 amap 510 13889944 32 |
|
pid |
pid list all debugged process id, list all project, break list and filter list. user use the cmd to check which project is debugged.
|
pid |
|
timeon |
timeon code time-used statistics switch on. clog command shows the used time. [00008][hello.java](00054) subc
x = new subc(); new subc() used 54 time pieces. x.add(21,3725) used a few time. |
timeon |
|
timeoff |
timeoff code time-used statistics switch off |
timeoff |
|
import |
import file import old or other pc debug package which output by export command , android should import debug package that build by win/linux platform BTR debugger. |
import /home/usr/x.pkg import /data/a.pkg ( android ) import c:\temp\a.dat |
|
export
|
export -s file export debug package to another test pc or android phone. |
export -s /home/usr/a.dat export -s i:\c.pkg |
|
pkgclean
|
pkgclean delete all old and un-used debug information package. |
pkgclean |
|
startpage |
start BTR debugger web server btrue.exe start web to edit code tree or look help document. http://127.0.0.1/btrcode.html edit code tree. http://127.0.0.1/help/userguide.htm see help document. In linux, port 80 needs root privilege run BTR debugger web server. BTRweb.exe can alse start web.
|
startpage |
|
stoppage |
stop BTR debugger web server use shutdown also stop web in BTRweb.exe |
stoppage |
Copyright (C) btrue software technology co.,ltd.
Copyright (C) btrue software technology co.,ltd.
In Java , C# , Android , Embed linux , BTR debugger use LAN network debug your process.
LAN
---------------------------------------------
| device1 | device2
Debugged process BTR debugger
The LAN can be wifi , ether mac.
There are 2 types of BTR debugger versions:
Common version is only used for study .
Enterprise version and standard version are used in commercial field. User who use this version must purchase it first.
The install of common version is simple.
Enterprise version needs btrue debugger server pc.
Standard version needs btrue box.
Company can download enterprise or standard version from www.btrue.com.cn.
1.Download Enterprise version from www.btrue.com.cn
2. Company must email the following information to us by btrue@163.net .
|
Company: |
|
|
Address : |
|
|
Postcode: |
|
|
Email : |
|
|
Company telephone ( no mobilephone) : |
|
|
Contact person name: |
|
|
Contact person mobilephone: |
|
|
Date: |
|
3. Our engineer will sent back the enterprise version or standard version package .
4. Our engineer send back Tentcent weixin 2-D barcode or Alibaba 2-D pay barcode by btrue@163.net. Customer buy BTR debugger by 2-D barcode.
5. Our engineer sent back btrue box and btrue debugger server pc to user.
6. replace btrue server files d:\BTRServer\setup\*.* (LINUX like : cp *.* /home/usr/BTRServer/setup/)
7. You can use BTR debugger to debug or test the large project now.
BTR debugger document |Codetree editor
The help directory is : .\home\help. The document are html files.
If you use BTR debugger in windows or android platform , double click userguide.htm to learn how to use the debugger.
If you use BTR debugger in linux or unix platform , use BTRweb.exe to study the help document.
If your operation system has already start www server , close it first.
BTR debugger web server occupy so much resource that you must close BTR debugger web server after you need not use it.
If you find disordered characters in browser, please set UTF character set.
1) Start the web server :
./btrue.exe
bd > startpage
2) Use mozilla brower , visit url:
http://www.btrue.com.cn/help/userguide.htm
3) Close the www server.
BTRweb > shutdown
BTR debugger document solution can also browser your code tree. It will help you find your code quickly. You can modify , find , replace in the whole code tree. Linux and Unix user will welcome BTR debugger code tree editor.
1) Start the web server:
./BTRweb.exe
2) Use mozilla brower , visit url:
http://127.0.0.1:9090/btrcode.html
3) In "Project path" field , input your code project path.
/home/usr/BTR/demo/...
Then click "Load" button to load them.
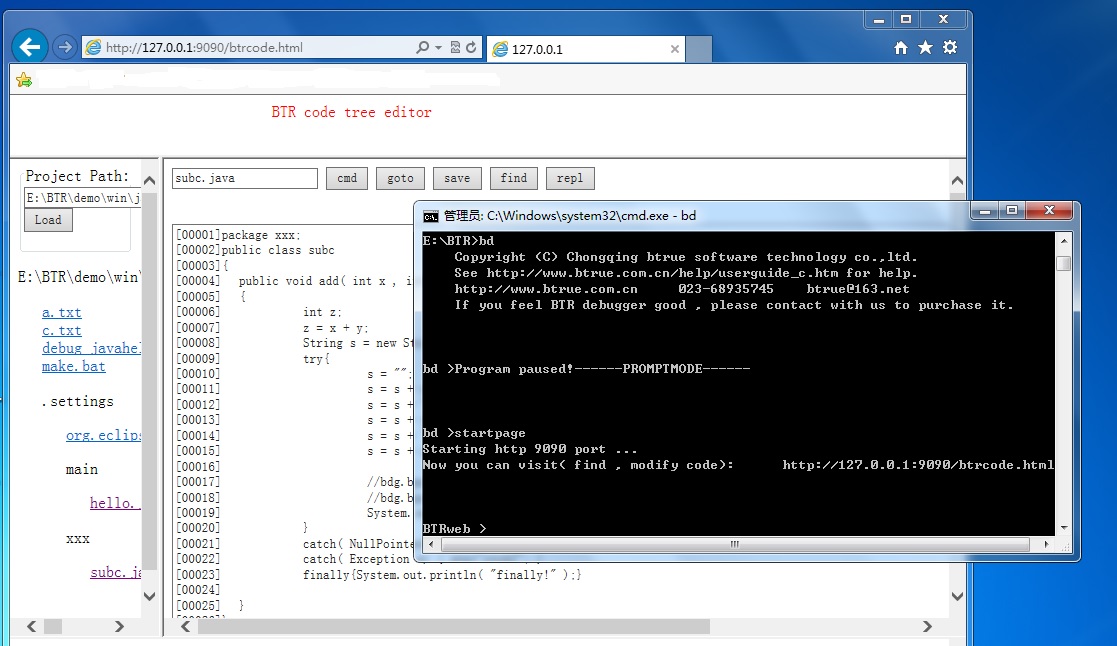
4) Click one code file link, it will show in main content windows.
5) Do find , modify , replace operation.
6) Quit mozilla brower.
7) Close the www server.
BTRweb > shutdown
|
Company: |
Chongqing btrue software technology co., ltd. |
|
|
|
|
Web site: |
www.btrue.com.cn |
|
|
|
|
Address : |
Shi qiao pu nanhua street 701#B2-9-8, High and new technology development zone of Chongqing , China. |
|
|
|
|
Email : |
btrue@163.net |
|
|
|
|
TEL : |
023-68935745(chongqing.china) |
|
|
|
|
Postcode: |
400039 |
|
Company: |
重庆比纯软件科技有限公司 |
|
|
|
|
Web site: |
www.btrue.com.cn |
|
|
|
|
Address : |
重庆市高新技术开发区石桥铺南华街701#B2-9-8 |
|
|
|
|
Email : |
btrue@163.net |
|
|
|
|
TEL : |
023-68935745(中国.重庆) |
|
|
|
|
Postcode: |
400039 |