��
Operate btrue debugger
��go back
��
Now we start to learn some classic btrue debugger operations:
1) build
7) GoLang debug
10) PV check
11��time statistic
12��android debug
13��embed linux debug
Build code , flash codelog , filter , inser break, print text, watch var , detail codelog, pv check , such operations do many times , it is a expert way!
��
1��build multi projects in shell( use bm.exe , not use btrue.bat )
A��
echo off
bm.exe build e:\exer\Cproj
bm.exe build e:\exer\Dproj
echo on
For code in dir e:\exer\Cproj\��bm.exe build code and add debug information��It used for background compiling & debugging��Big company building , packing , debugging all in back server.
B��
bm.exe build e:\exer\Eproj modX
For code in dire:\exer\Eproj\modX��bm.exe build whole project code and only add debug information in modX.
��
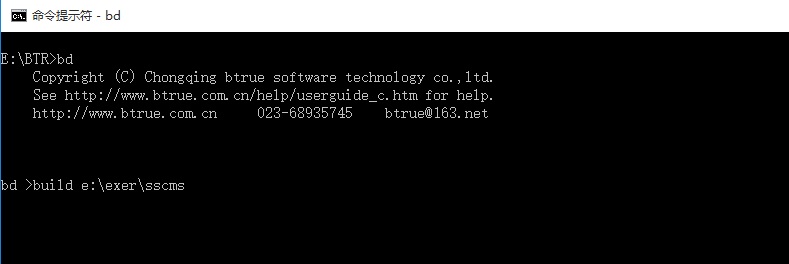
2)build in btrue.bat | btrue.sh prompt
��
bd > build e:\exer\myproj modX
btrue.exe build whole project code and only add debug information in modX
bd > build e:\exer\myproj
btrue.exe build code and add debug information.
3) build and debug only 1 or 2 files
��
bd > build e:\exer\myproj a.c
b.c
build myproj, only debug a.c b.c . watch its codelog or variable . The programme runs fast , the process log becames more clearly.
bd > build e:\exer\myproj SetData*.go
build myproj, watch SetData*.go . program runs rapidly.
By the way , some projects such as mcu interrupt code or embed camera data transfers to app, need to assigned file to debug ��so data or variable be traced in high-speed system.
��
��
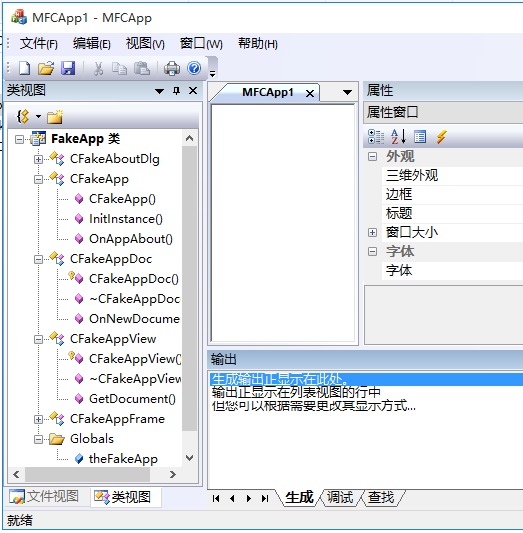
4) exercise
build��
compiling:
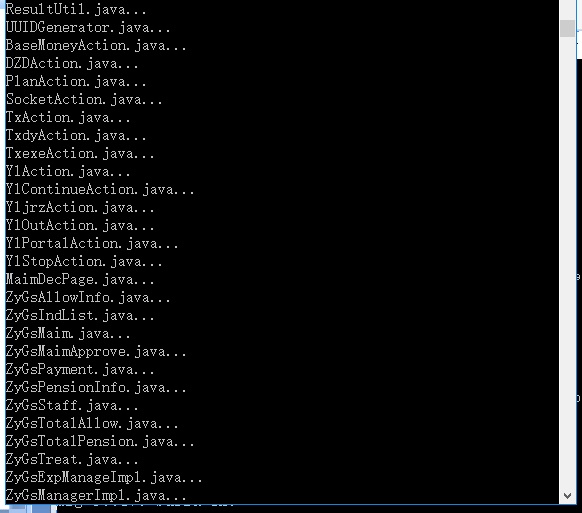
��
build ok:
��
��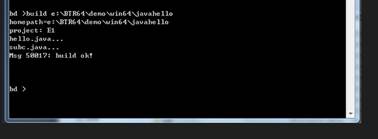
Java web deploy��
user do not modify project which can also deploy on web server .
��
��
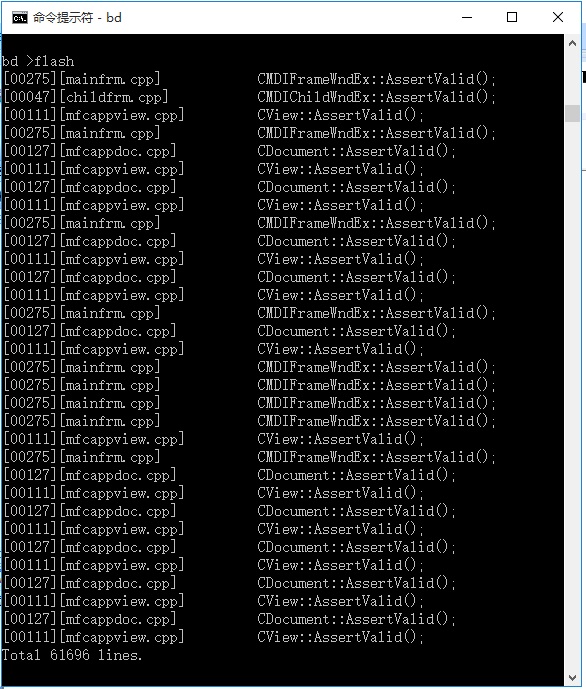
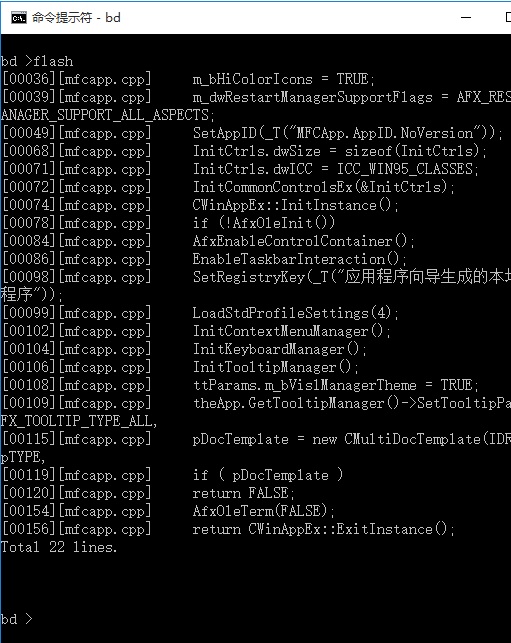
flash command��
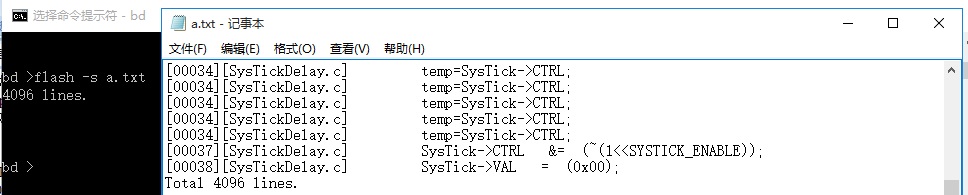
bd > flash
-> get process log�� only show the latest 256 lines.
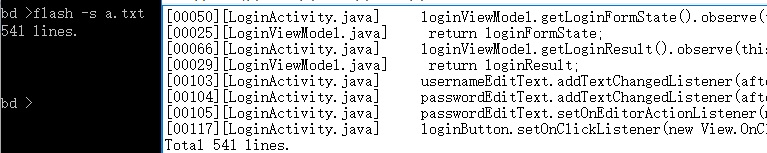
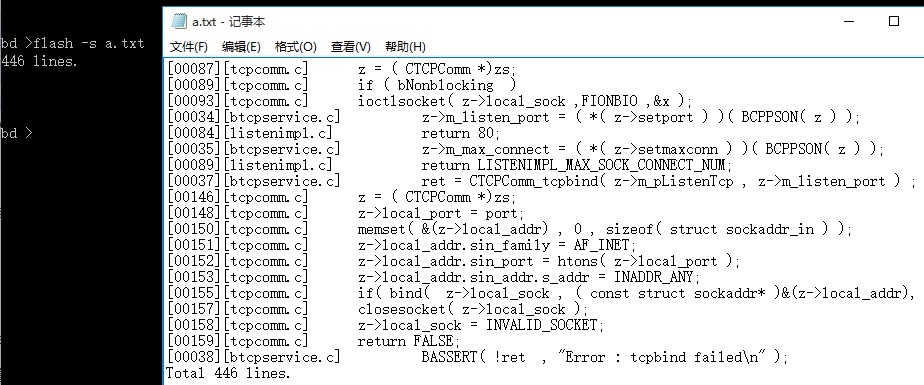
bd > flash �Cs a.txt -> get process log�� only save the latest 60000 lines to file.
bd > flash a*.java
-s a.txt ->
only save a*.java process log
bd > flash c.c : 78 �Cs b.txt -> only filter to save a function
which include a.c 78 line.
exercise��
build and run��
 ��
��
��
get
process log��
��
��
��
a sample��
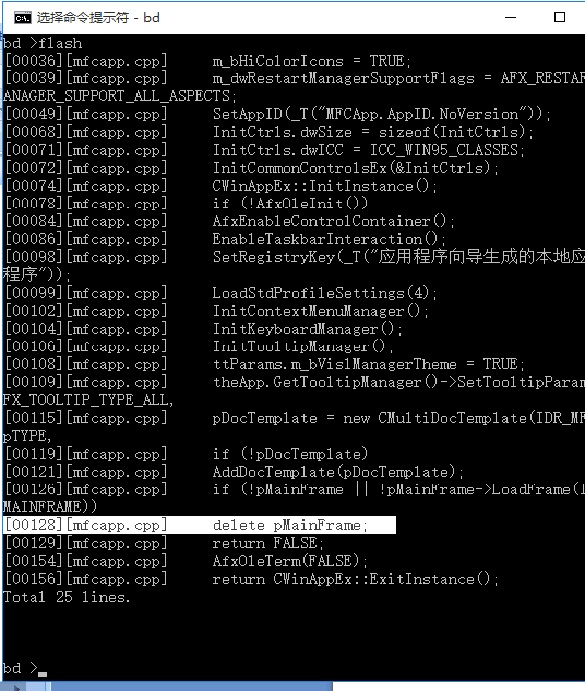
app not response ��look the process log ��" delete pMainFrame; " shows the obj released��why? look its code��
The
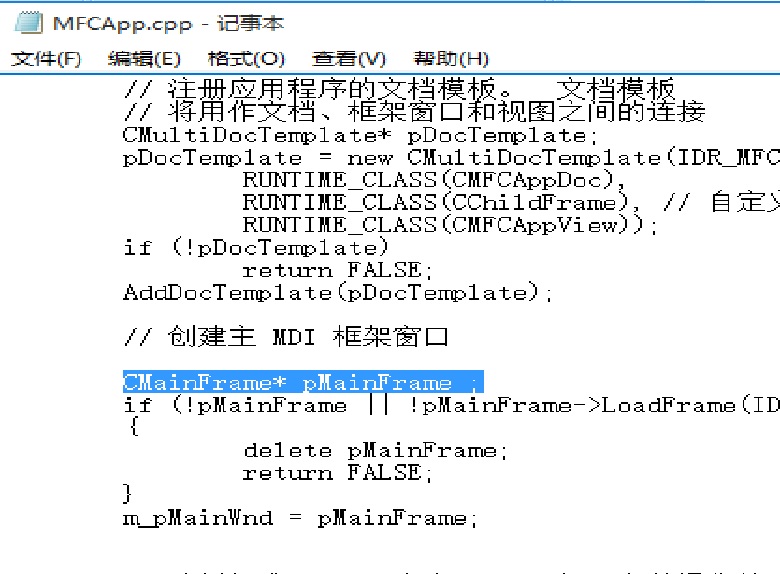
reason is pMainFrame be used without be created��modify��
CMainFrame *pMainFrame;
pMainFrame =
new ��
if ( !pMainFrame || !pMainFrame->LoadFrame(..)��OK�ˡ�
The next process log��
app no
windows��get process log ��shows "return
FALSE"��"if ( pDocTemplate
) return FALSE" , if condition is error. modify��
if (
!pDocTemplate )
return FALSE;
Then its OK. so checking process log & modifying bugs is
far more better than guessing bugs.
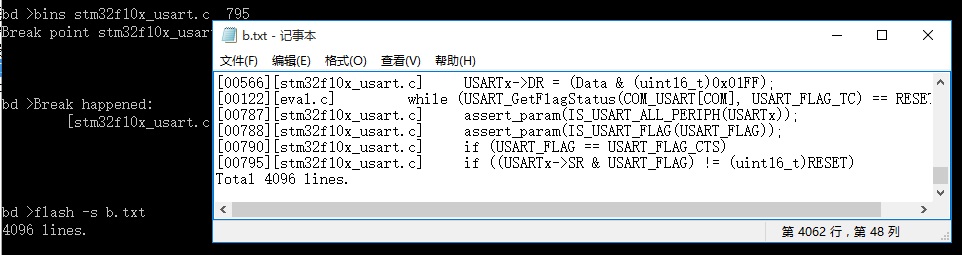
bins command add a break pointer , if no crashed code, you should add a break before run it. the process will run more rapidly.
bins a.py 10 // insert break point at a.py 10
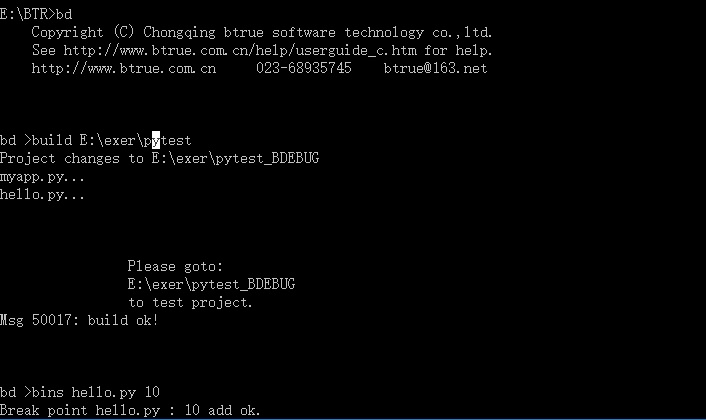
run
python��paused at break point
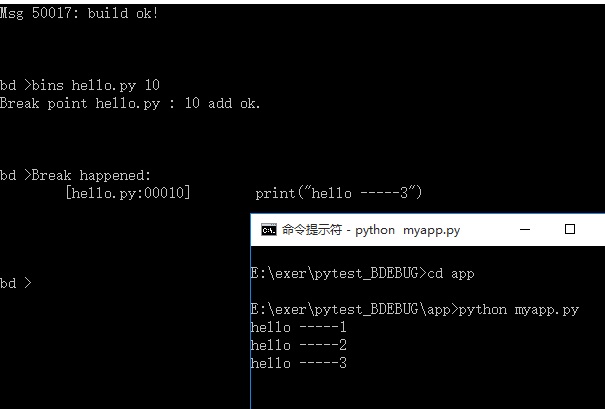
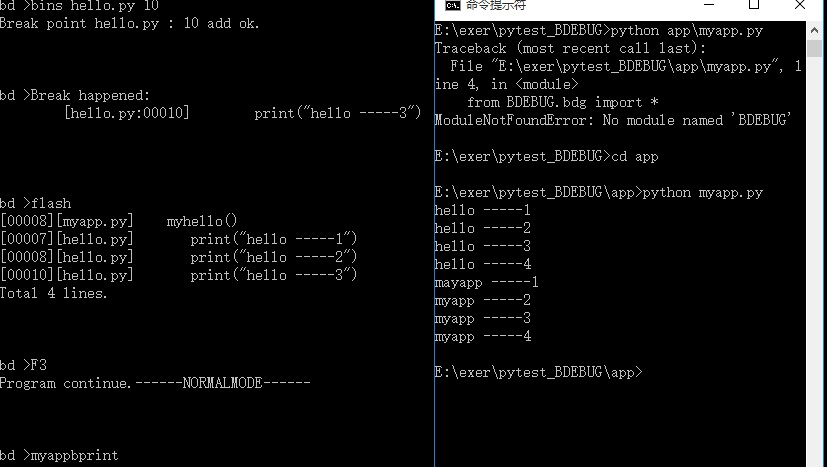
Get
process log ��press F3 hot-key to continue
��
��
��
insert bprint( string ) in code , then use btrue.exe buildd it . you can see the output text.
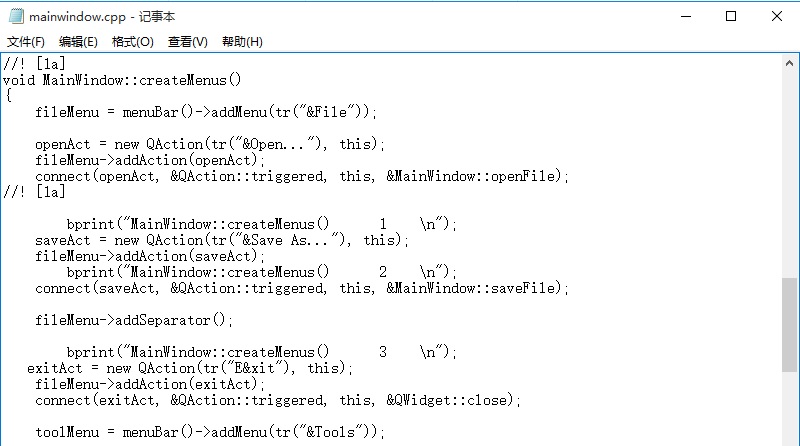
btrue.exe build:
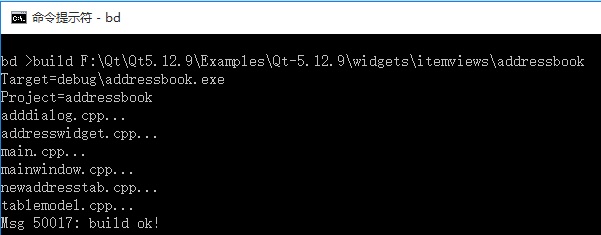
runs:
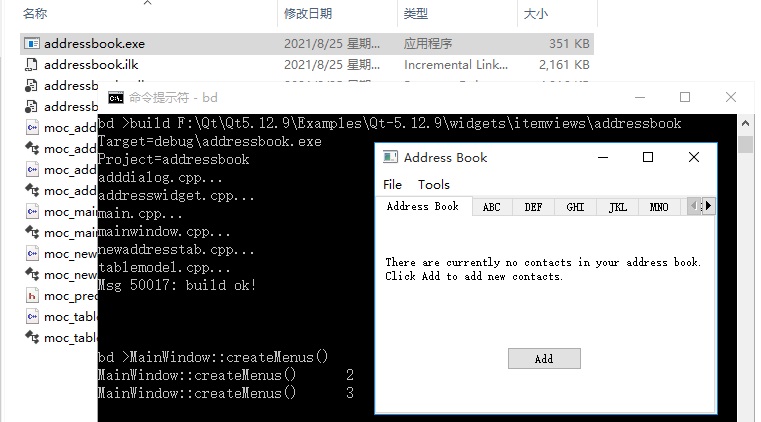
��
3 lines
printed
��
��
��
��
use bwatch( ) to watch the value history of the assigned variable. data_type is basic data type , or its data array
example:
C: bwatch( "title" , var_address , data_len );
bwatch( "Person" , &p , char , 128 ); // C can watch a whole struct
��
GO: bwatch( "title" , var_name , data_type , data_len )
bwatch( "PersonNum" , p.num , int , 8 )
bwatch( "PersonName" , &(p.name[0]) , rune , 10 )
bwatch( "Wives" , p.wives , [8]string , 64 )
bwatch( "Wifeslice" , wive_slice , []string , 64 )
��
C# & JAVA : bwatch( "title" , class_name , obj , member_name , data_type , data_len );
��
bwatch( "title" , Person , this , p.age , int , 4 ); // if bwatch (p.age) called in Person.java , obj == this
bwatch( "title" , Person , Person , p.age , int , 4 ); // if p.age is static int , obj1.age == obj2.age== class.age
bwatch( "title" , null , null , k , int , 4 ); // error , stack var k can not bwatch()
bwatch( "title" , Person , chongqing , p.age , int , 0 );// close bwatch(p.age) , if p.age will leave its range.
��
Go: bwatch( "title" , var_name , data_type , data_len )
��
bwatch( "age" , p.age , int , 8 )
...
bwatch( "age" , p.age , int , 0 )
bwatch( "manwives" , p.wife , [8]string , 128 )��
��
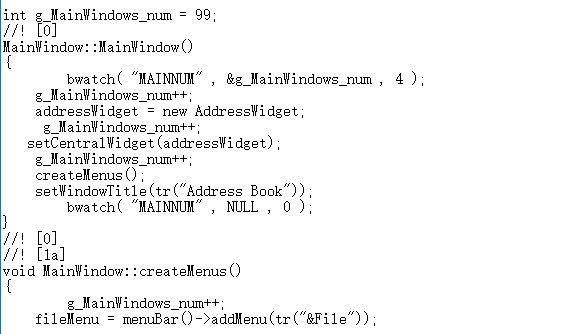
build:
runs it ��then use vlog command get var log��
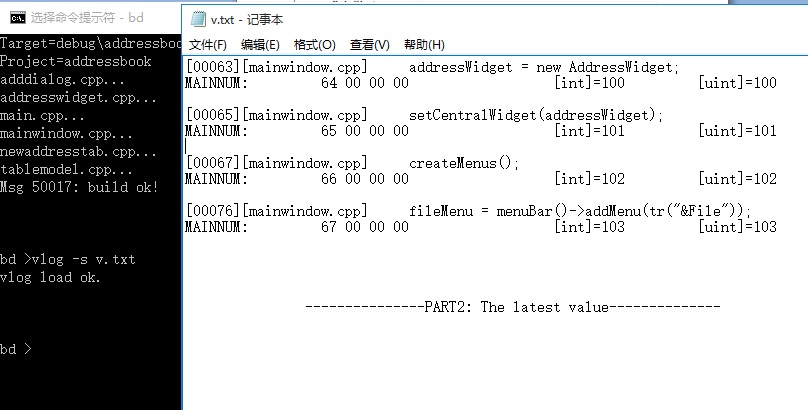
It shows g_MainWindows_num have 4 values
��
In mcu( such as stm32) debugger, bwatch() can only see its value , cannot see its value history.
��
In Java | c#, bwatch() can see object value history:
bwatch( name , class , object , member , datatype , datalen ); //open watch
bwatch( name , class , object , member , datatype , 0 ); //close watch
datatype is basic data type and its array.
��
for example :
Person p = new Person( 20 , 40 );
p.age = 30;
p.wife = {"linda" , "lisa" , "", "" };
bwatch( "AGE" , Person , p , age , int , 4 );
bwatch( "wives" , Person , p , wife , String[] , 128 );
...
bwatch( "wives" , Person , p , wife , String[] , 0 );
bwatch( "AGE" , Person , p , age , int , 0 );
��
The following is Go PrintScreen :
insert bwatch() before build
![]()
build
��
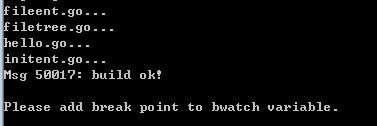
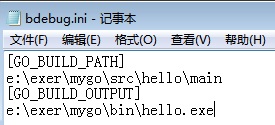
build ok [GO_BUILD_PATH]��[GO_BUILD_OUTPUT] auto write to bdebug.ini
break trigger, vlog -s v.txt, shows var of a modify history
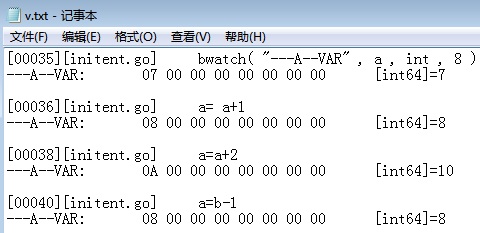
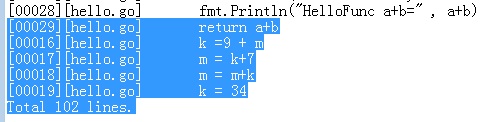
flash -s a.txt , the tail of 102 lines hello.exe log
��
��
��
lon command unlock 60000 lines limit��allow btrue.exe record the first code line:
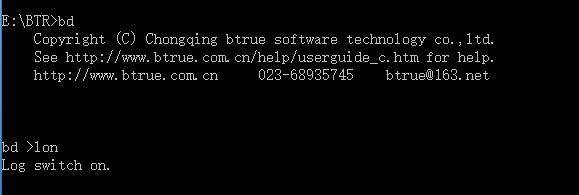
The beginning of process :
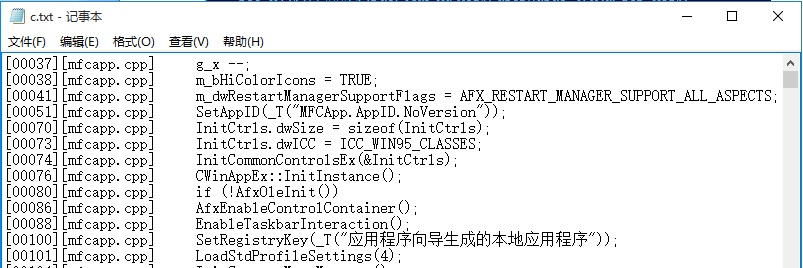
The latest process ��
All process log total 402861 lines.
��
��
��
��
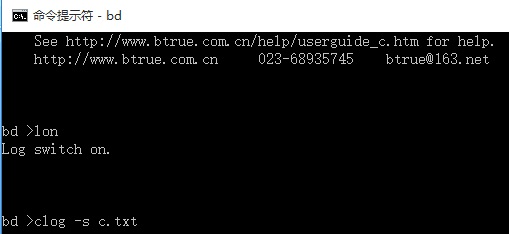
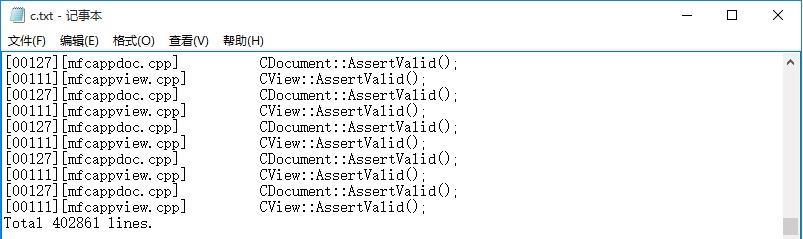
Filter
process log ��drop un-import log��simplify to find BUG��
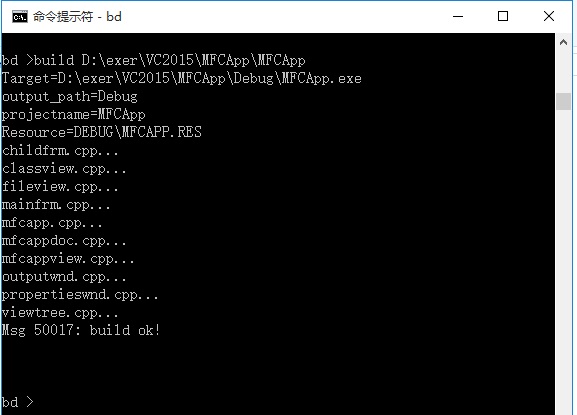
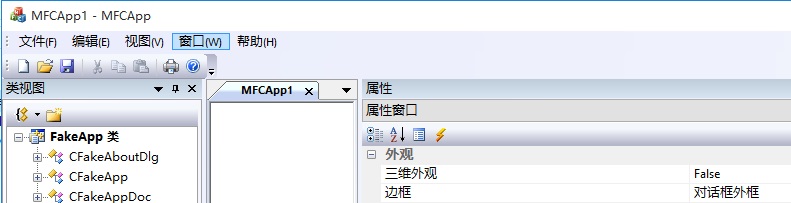
Only see MFCApp.exe main entrence code��
clog
mfcapp.cpp �Cs d.txt
��
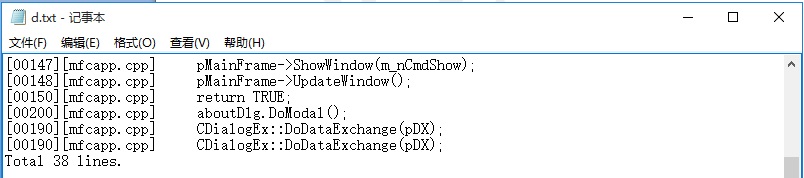
Only see the funxtion of classview.cpp OnCreate()��OnCreate() include the 77th line��use clog classview.cpp 77 ��

Total 20 lines��the whole log is 200000 lines����its a comfortable experience to filter log & find bugs.
��
There are
many PV pair functions��like open close , connect disconnect. CreateObj , DestroyObj��malloc free , new
delete��use PV command wach
its creating , destroying. malloc free , new
delete already PV tracing��others PV function should config in bdebug.ini first.
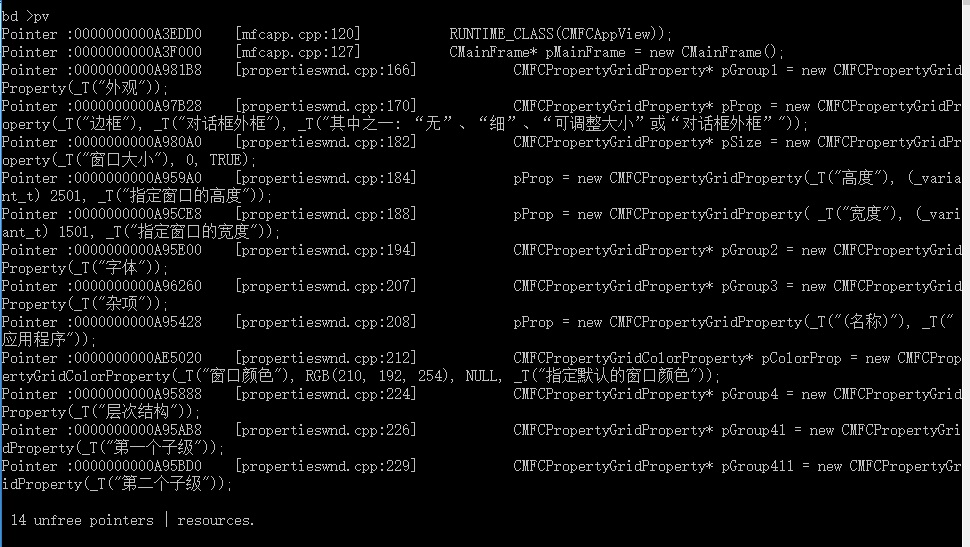
run btrue.exe

then run
D:\exer\VC2015\MFCApp\Debug\MFCApp.exe��
exit MFCApp.exe��use PV command to look the
un-freed objs��
��
��
There are
14 objs not deleted��or not offfical released. it is
bad. Good code should offically , completely release all objs.
��
��
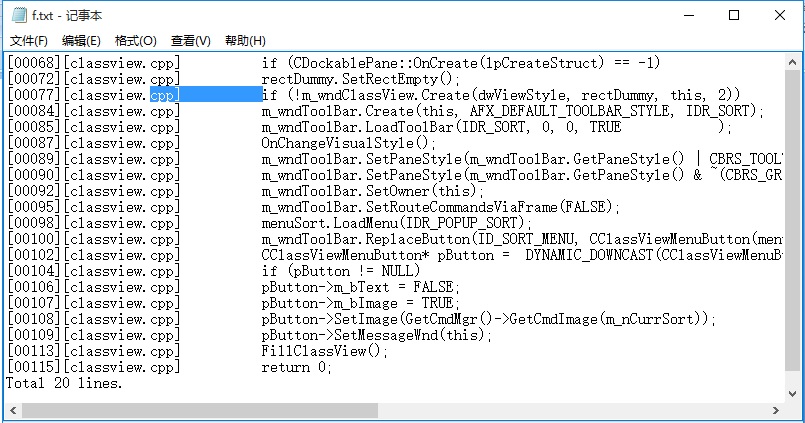
timeon command
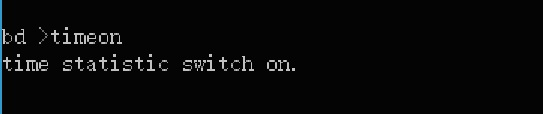
run��
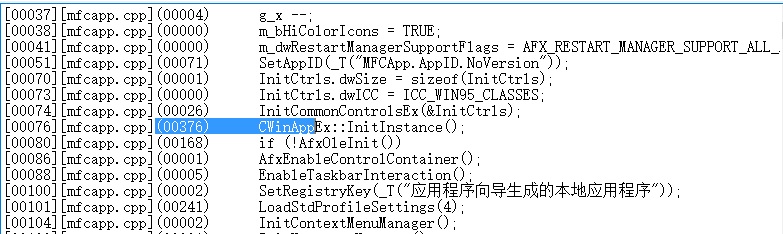
get
process log ��it already included the used time pieces��
By
process log ��wa can see
mfcapp.cpp 76 lins " CWinAppEx::InitInstance()" used 376 time-pieces��mfcapp.cpp 101 "LoadStdProfileSettings(4)"
used 241 time-pieces��code performance tunning begans from the two
functions.
��
��
��
��
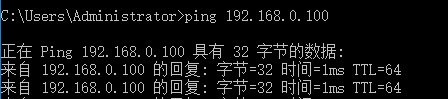
network��
the network is home-used WIFI router��connect PC with ether card�� connect android phone use WIFI password. Test shows PC IP is 192.168.0.100 ��the android IPis 192.168.0.101��ping :


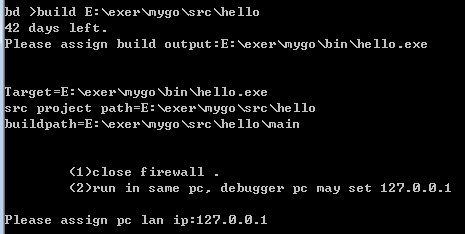
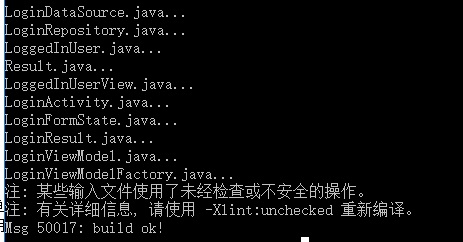
build APP��
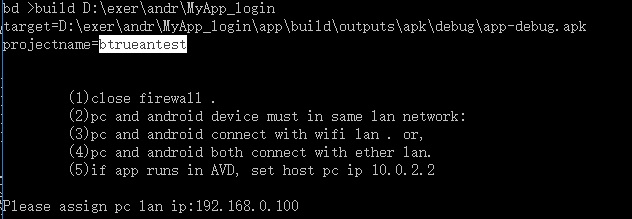
notice��please
assign pc lan ip:192.168.0.100
build ok��
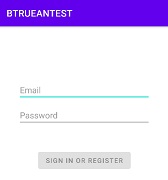
use USB connect phone and PC��download outputs\apk\debug\app-debug.apk to android��find app-debug.apk file in phome��click it to install and generate btrueantest app.
click btrueantest icon��run it:
get the process log , the following
shows App begining��
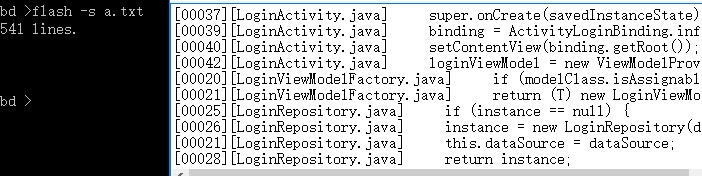
The following shows the latest Ap log
Use process log , break point ,
printing text|variable such ways��you can debug android APP.
Debugging and running both smoothly.
��
��
First ��embed linux device and host pc ��include
btrue.exe��at the same LAN��
host PC ip: 192.168.0.101

��
embed
device ip�� 192.168.0.100
![]()
host PC
(192.168.0.101 ) ping embed linux device��192.168.0.100��
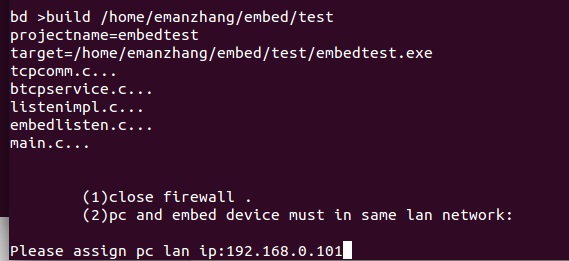
build��assign the host pc IP��192.168.0.101 , which have btrue.exe.

��
Download
the target programe file to embed board��
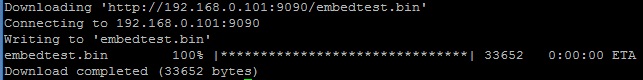
��
runs embedtest.bin
��
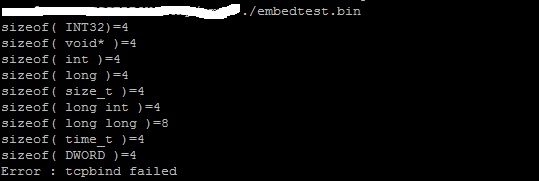
get process log��
��
embedtest.bin crashed at btcpservice.c 38 , it encounters assert.
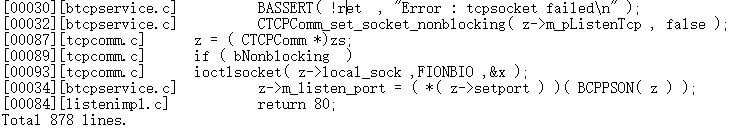
Insert a break point at [00084][listenimpl.c]��run again��
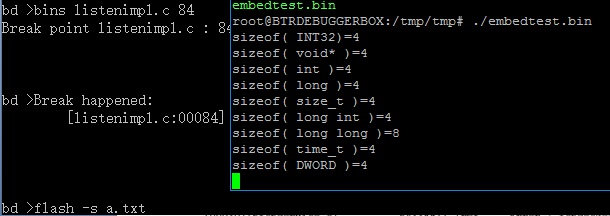
��
How to
correct the bug , can you complete it ?.
��
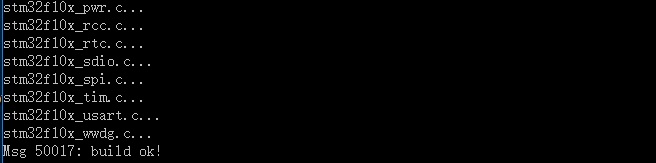
build��
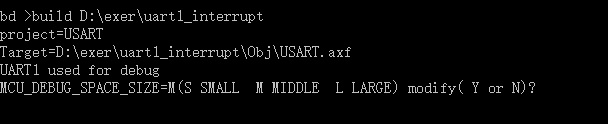
according to MCU ram size��the default is middle��M����selecte it and continue��
��
build ok��burning D:\exer\uart1_interrupt\Obj\USART.axf to mcu
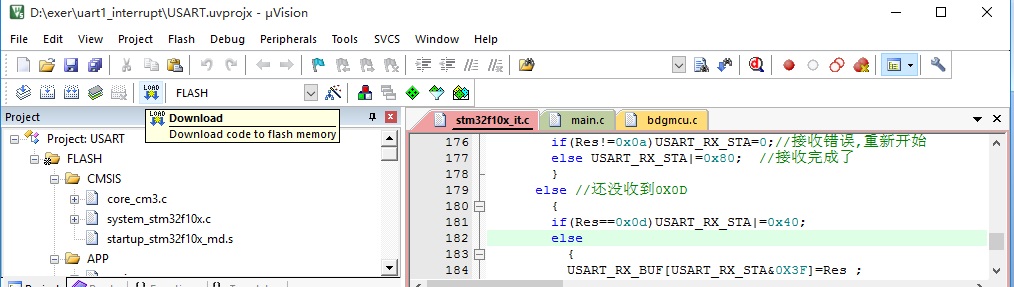
use Keil UVision tool ��clict the download icon to begin to burning.
��
connect mcu ��
use connmcu command
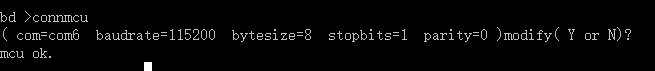
��
get process log��
insert a break point��
use uart tool ��look the output��
![]()
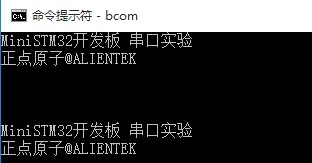
This is the uart output data of STM32 program.
��
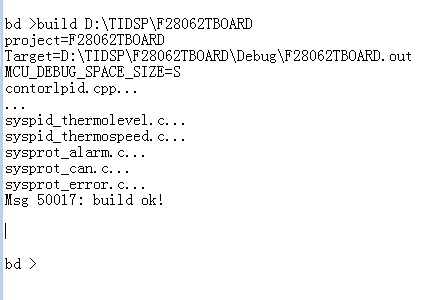
Modify mcu space , the following shows a sample of CCS mcu:
file : F28062.cmd
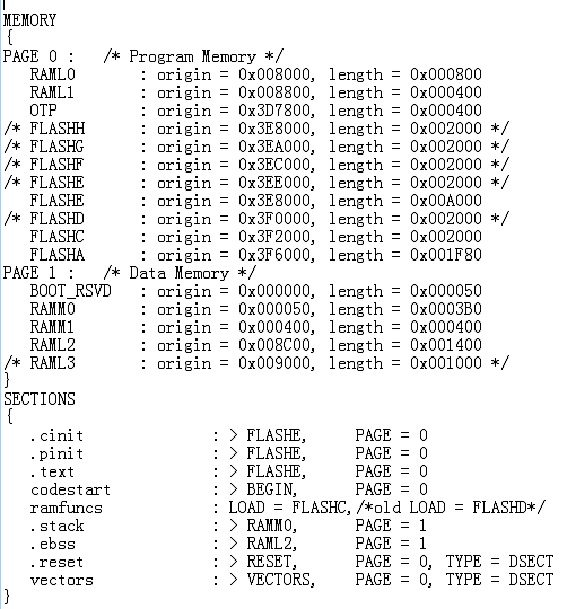
(1)
Delete FLASHH FLASHG
FLASHF , combine it to FLASHE
(2)
Delete RAML3 , combine it to RAML2
(3) Map
address sections to big FLASH or big RAM
After do these , FLASH and RAM sections became more large. Build mcu will OK now.
��
CCS build OK UI:
��
��